
An honest look at why people add items to their cart but never finish buying
A woman looks through jackets on her phone during her lunch break. She found the website recommended by her friend and liked one of the jackets, so she added it to her cart. But then, she left.
Perhaps the shipping cost was too high, or maybe the website crashed. It could have been any number of things, but now this woman is just another statistic. She is, in fact, one of the seven out of ten people who added products to their cart but did not end up purchasing them.
This scenario plays out millions of times every day, in different stores, different countries, and different products. Most often, guides on reducing cart abandonment talk about easy solutions like better photos, fewer fields to fill, and trust badges. While these are all helpful, they only scratch the surface.
This article, however, goes beyond easy solutions and tries to explain the psychology of purchasing and what exactly causes people to change their mind, based on research.
1. The Real Shape of the Problem
Let’s begin with the most common statistic of them all, the seven out of ten. In reality, Baymard Institute has been tracking cart abandonment rates for years, and the number hovers around 70% annually, based on their research.
While some of these abandoned carts are due to people browsing the site and comparing prices, or just getting distracted and leaving, these are all normal parts of the browsing process. A store can’t really do much about that.
However, if we take those out, we can see the real issue.
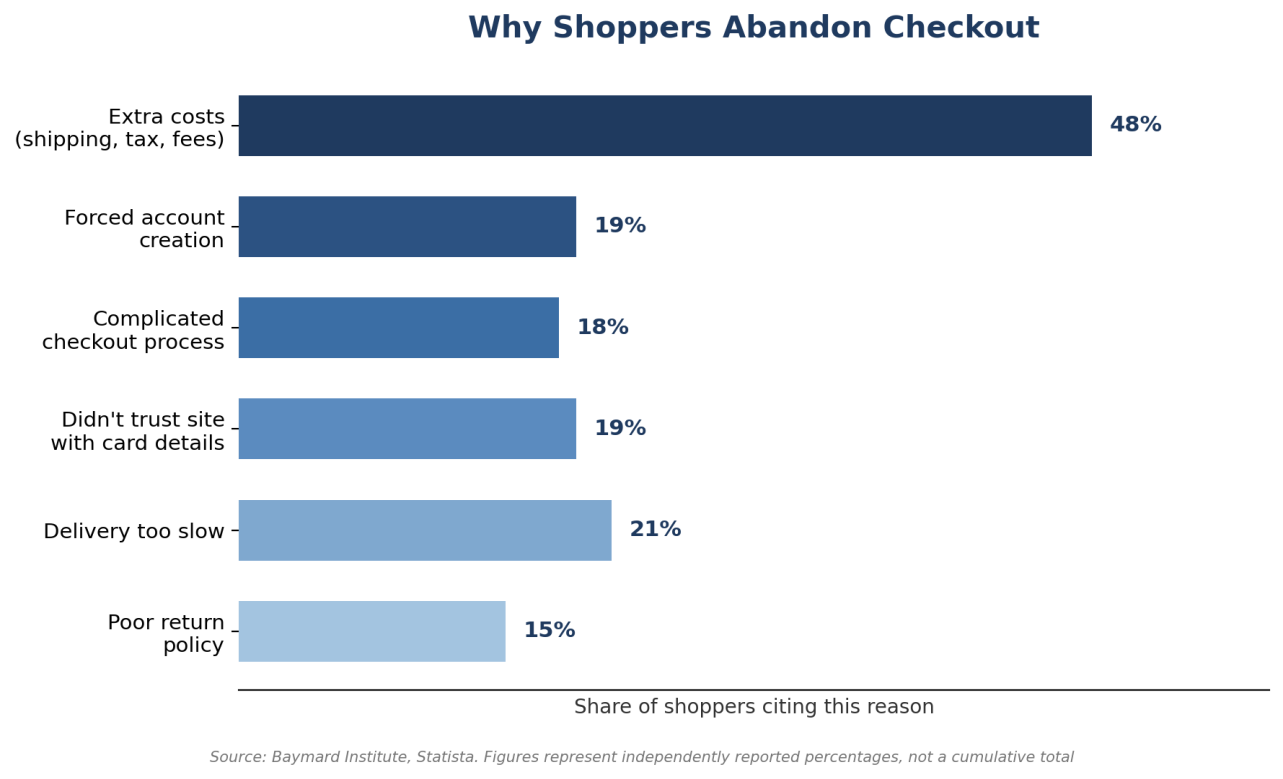
Figure 1: Reasons shoppers give for abandoning checkout
Unexpected costs during the final stage are the most frequent reasons for cart abandonment, according to 48% of surveyed shoppers. This means that almost half of the people who give up on buying something online do so because of last-minute cost surprises. This represents not an edge case, but a broad chasm in the conversion fundamentals.
Shoppers who start their purchase on a mobile device are much more likely to abandon their cart during checkout. Between 10-15% more mobile users than laptop users give up on the process due to the difficulty of the interface. This could mean small buttons, long forms, or poor autofill suggestions that are magnified on a tiny screen.
To give some context to just how much this matters, global e-commerce sales are estimated to be worth over $5 T annually. With a 70% checkout abandonment rate, this means that trillions of dollars in theoretical sales are simply vanishing at the final purchase step. Of this lost revenue, a considerable chunk should be recoverable by addressing the most common pain points.
2. Know Your Numbers Before You Guess
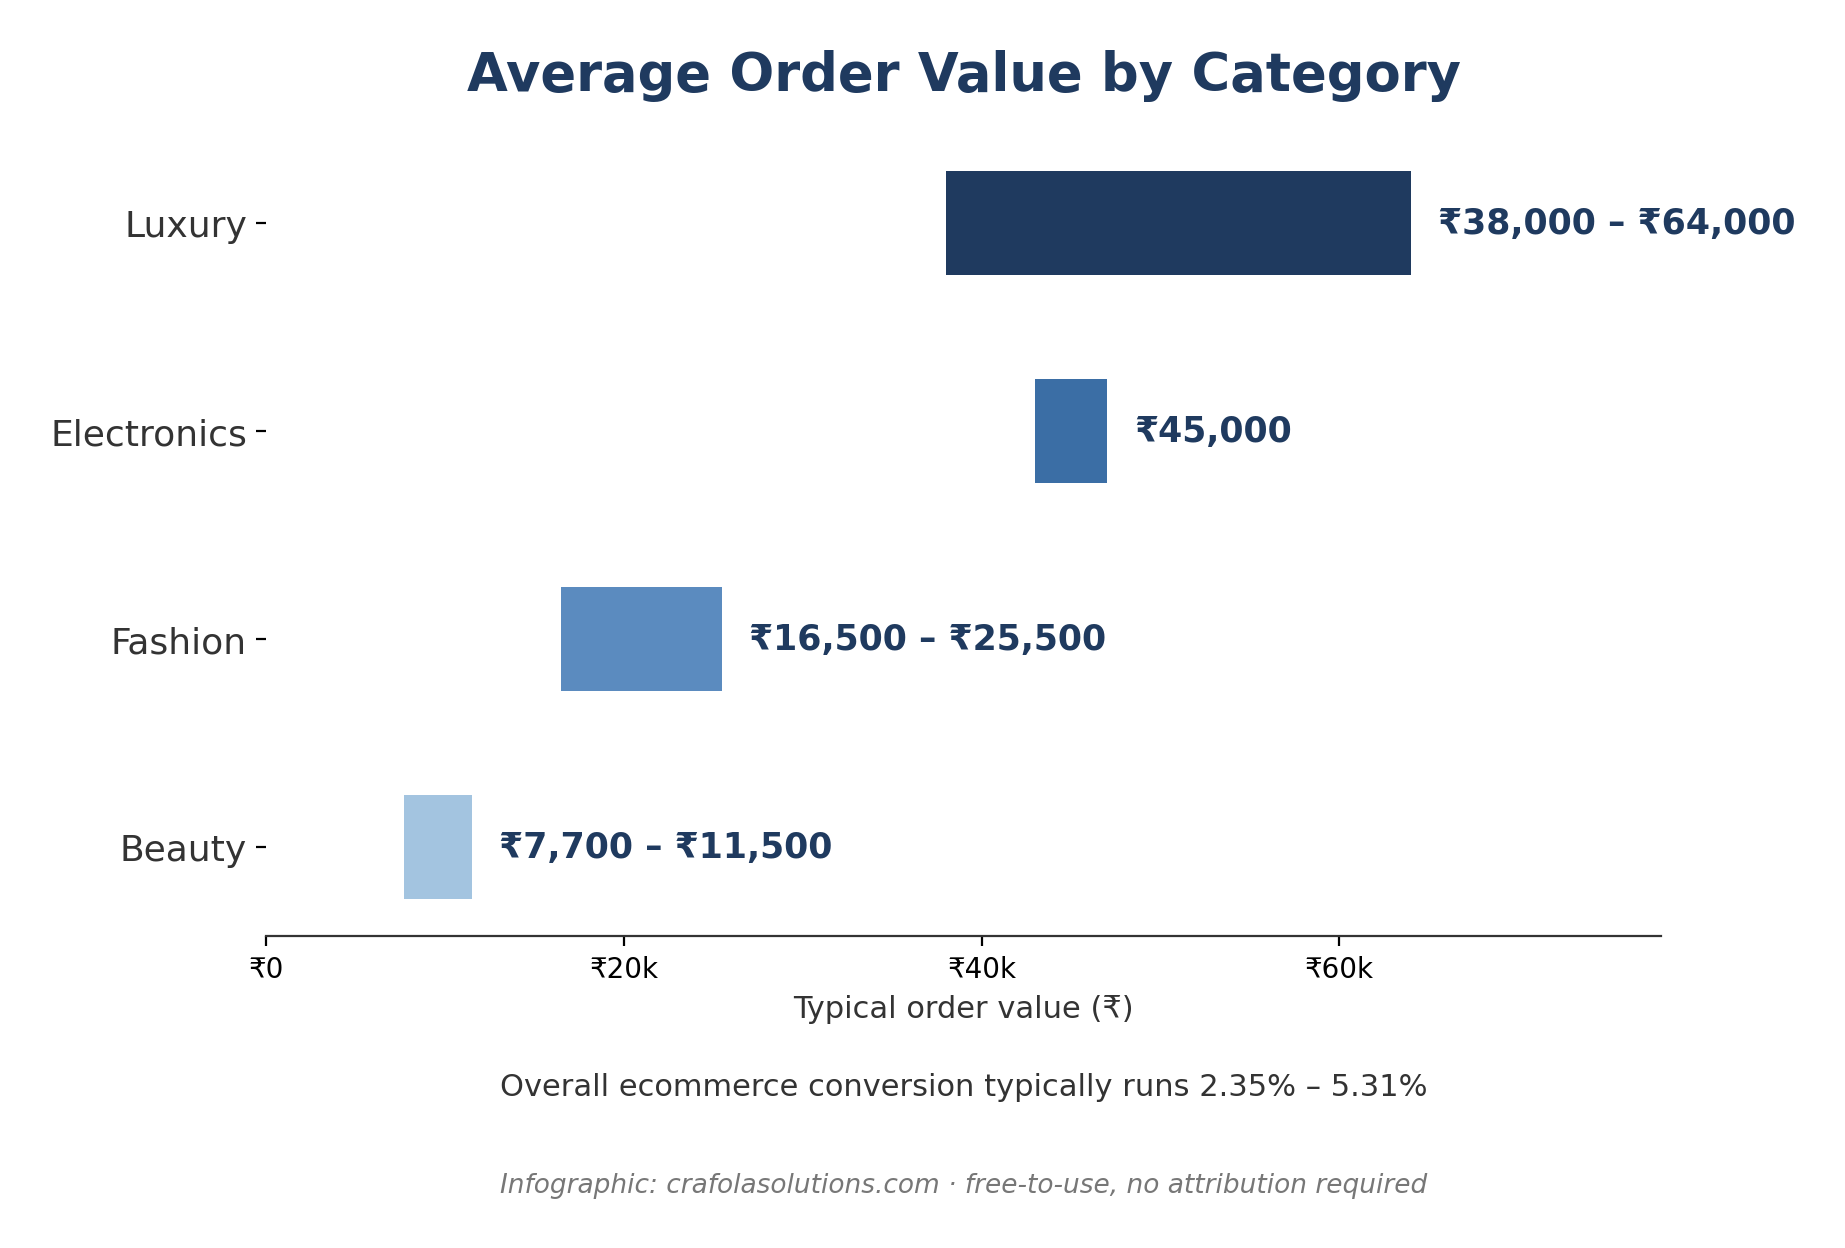
Figure 2: Average order value by category, in ₹
Your team must have a general idea of what conversion rate improvement tactics have worked and which have not. Even if you do not have hard analytics to back this up, you most likely already know the approximate conversion rate you are aiming for. However, there is not much use in only having a target figure if your team does not have any context for it.
For most e-commerce companies, average conversion rates fall somewhere between 2.35% and 5.31%, with most categories having much narrower ranges. A women’s accessories shop and a men’s phone case store would have wildly different conversion rates.
Luxury: Average order value (AOV) of ₹38,000 – ₹64,000. Conversion rate: Lower than average, witha longer decision-making process
Electronics: AOV of ₹45,000. Shoppers will research extensively before making a purchase.
Fashion: AOV of ₹16,500 – ₹25,500 Higher returns and seasonality
Beauty: AOV of ₹7,700 – ₹11,500. Lower AOV but higher repeat purchase rate
If your conversion rate is within the average range for your category, there is not much need to overhaul your entire strategy just to improve by 1%. If your performance is at least 5% below the benchmark, there is likely an exact issue that you can resolve. This principle also applies to any other metric that your team tracks; always compare it to the relevant averages and only then decide whether it needs improvement.
At the same time, always keep in mind that a significantly higher rate is not necessarily a good thing. In some cases, a rate that is 10% above the average for your category might be the result of skimming traffic that only ever buys on your site anyway. This is especially true for directories and marketplaces.
3. The Quiet Reasons People Decide What They Decide
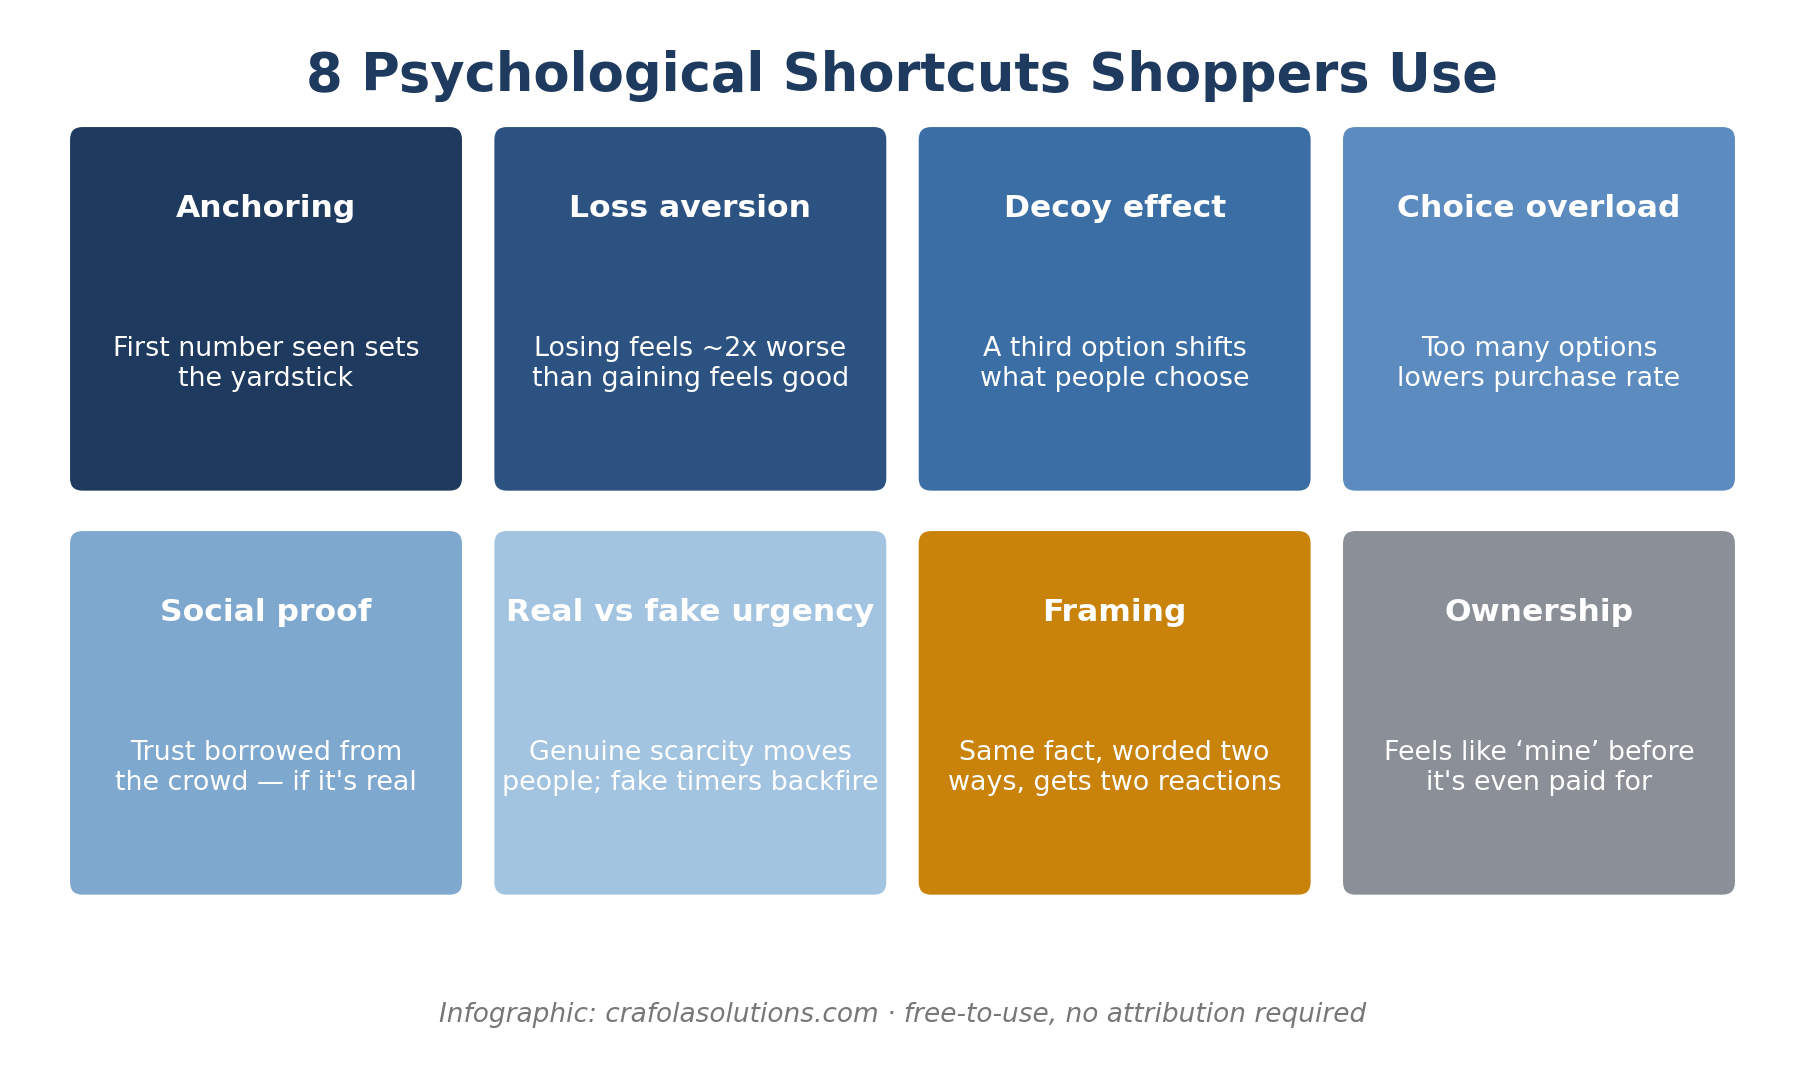
Figure 3: Eight psychological shortcuts shoppers use
People do not really think about what they buy; most purchase decisions are made on a subconscious level through various psychological mechanisms. Scientists have been studying them extensively for years, and it is possible that your business already takes advantage of several of them without your team even realizing it. There is nothing wrong with using psychology to your advantage if you are aware of the ways in which you are doing so.
Anchoring
The first price that a shopper sees influences their perception of value, so a crossed-out “original” price next to a discounted one is useful in convincing the buyer that they are getting a good deal.
Loss aversion
Losing something is much more painful than gaining something of the same value is pleasant. This is why warnings about losing discounts or rewards are much more effective at persuading people than presenting them with an outright offer.
The decoy effect
Giving customers three options, one of which is clearly worse than the other two, will drive them to purchase the “better” one instead of making them compare the two lower-value options.
Choice Paralysis
More options don’t always lead to more sales. Barry Schwartz’s research on choice paralysis shows that a larger selection can decrease purchase frequency because evaluating too many similar items can be exhausting before a decision is even made. A short list of curated items or a simple label like best for beginners reduces this mental effort without limiting the overall catalog.
Honestly Social proof
The “X people are currently looking at this” mechanism is an effective way to demonstrate demand. Counterfeiting traffic will damage your credibility with the real shoppers long before regulators take any action against you.
Real urgency
A product with genuine demand should see its conversion rate spike right before selling out. Counterfeiting the same effect with countdown timers, however, will lose credibility with the very first shopper who notices that they do not actually work.
Framing
Presenting the same information in two different formats will often yield vastly different results. For example, 95% satisfaction rate and 1 in 20 customers were unhappy to describe the same statistics, but most shoppers would be more likely to purchase on seeing the former.
A sense of ownership
People who have something will always value it higher than those who do not, so encourage repeat purchases by allowing customers to “try before they buy”. Free trials, open return policies, and substituting ” Add to Bag ” with ” Add to Cart ” are all excellent examples of this psychological phenomenon.
4. Speed Is a Priority
A slow website not only creates a poor impression but appears unprofessional to many visitors. Someone browsing your page may assume that if your technology is outdated or poorly optimized, your business practices are the same. This can be especially detrimental to conversion rates, with even a minor delay during the crucial final steps being enough to push the buyer away.
.
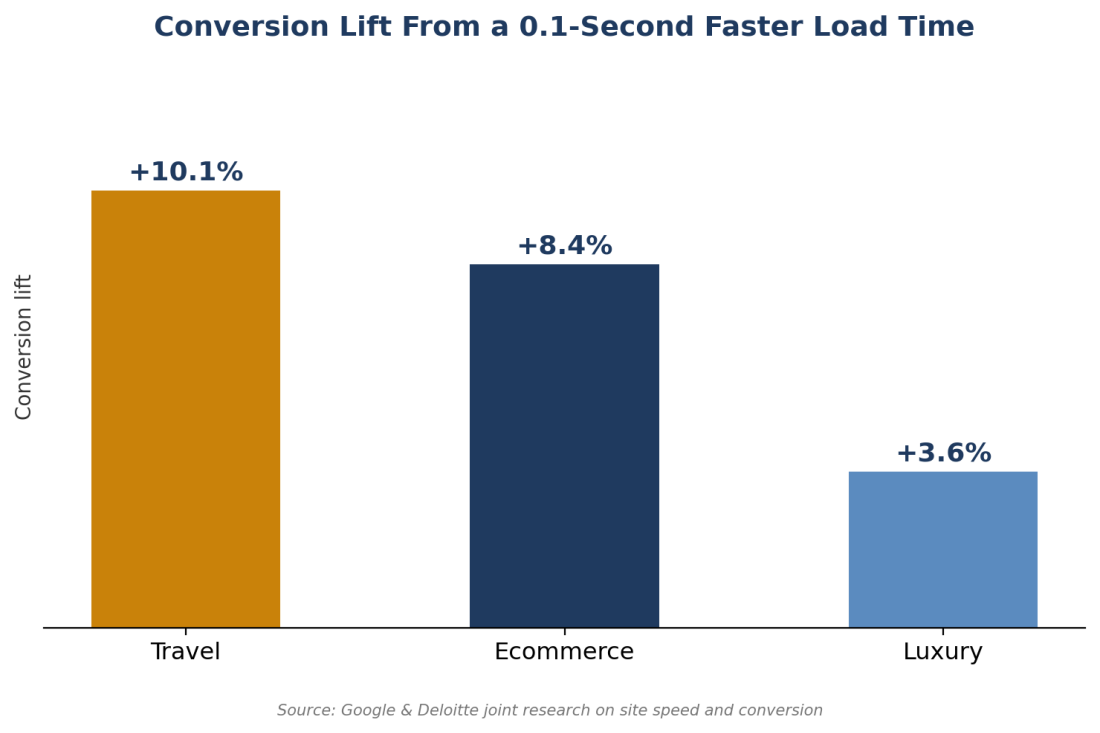
Figure 4: Conversion lift from a 0.1 second faster load time, by sector
Separate research by Portent indicated that a page loading in one second converts about two to three times better than the same page loading in five seconds. This difference is larger than most teams anticipate when deciding on engineering priorities.
Another study, this time conducted by Portent, demonstrated that a page that loads in one second can have conversion rates 2-3x higher than a similar page that takes five seconds to load. In other words, every second of improvement has a much higher impact than most managers would assume when deciding to optimize for speed.
Google officially recognizes three metrics that determine a webpage’s performance and should, therefore, be optimized: Largest Contentful Paint, Interaction to Next Paint, and Cumulative Layout Shift, collectively known as Core Web Vitals. As a rule of thumb, remember that it should take no more than 2.5 seconds for the main page content to load and prioritize mobile performance, as the majority of your traffic will come from smartphone users.
Speed and trust are tightly linked, so always consider the user’s journey on your page. Optimizing the checkout process is important, but it will not improve a shopper’s perception if an image slider in the middle of your page takes too long to load.
5. Final Seconds at the Till
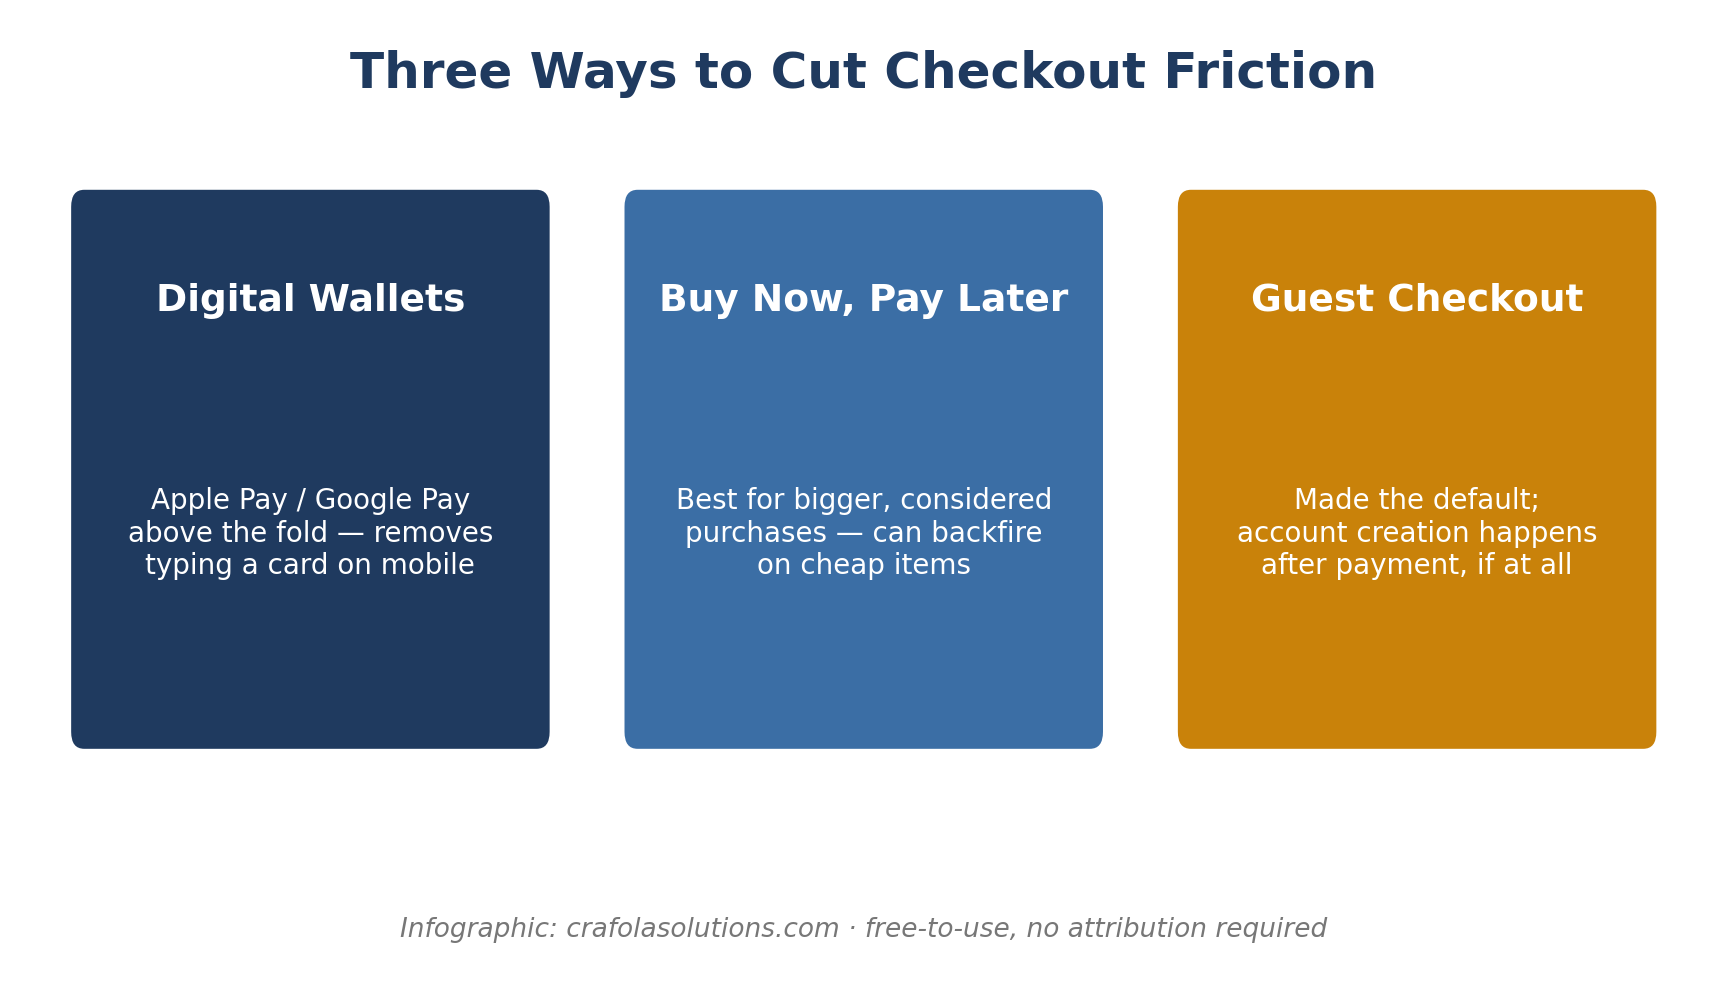
Figure 5: Three ways to cut checkout friction
The checkout process has the highest cost per friction, which means that even small inconveniences can be detrimental to revenues. Digital wallets such as Apple Pay and Google Pay remove the largest barrier to purchase for mobile users by replacing long forms and PIN enters with a simple tap. Putting a wallet button on your product page can make it the most popular payment method among your mobile users within a few months.
Buy now, pay later options also alleviate some of the pressure, although they are most effective for higher-value purchases that require more consideration on the buyer’s end. For smaller orders, they might simply confuse the customer with yet another step in the process.
Remember that every additional payment option that you enable should serve a specific purpose. Most often, companies use them to replace the friction that they are aware of, but there might be ones that you are not even considering. Always ask yourself why any button should be there – if it does not immediately alleviate a pain point that you know exists, it should be removed.
The same philosophy should be applied to the guest checkout option. If it is available to your visitors, it should be the default, with account registration taking place only after purchase. This way, you remove any perceived value from signing up while maximizing the chances of a sale.
6. Personal, Without Being Creepy
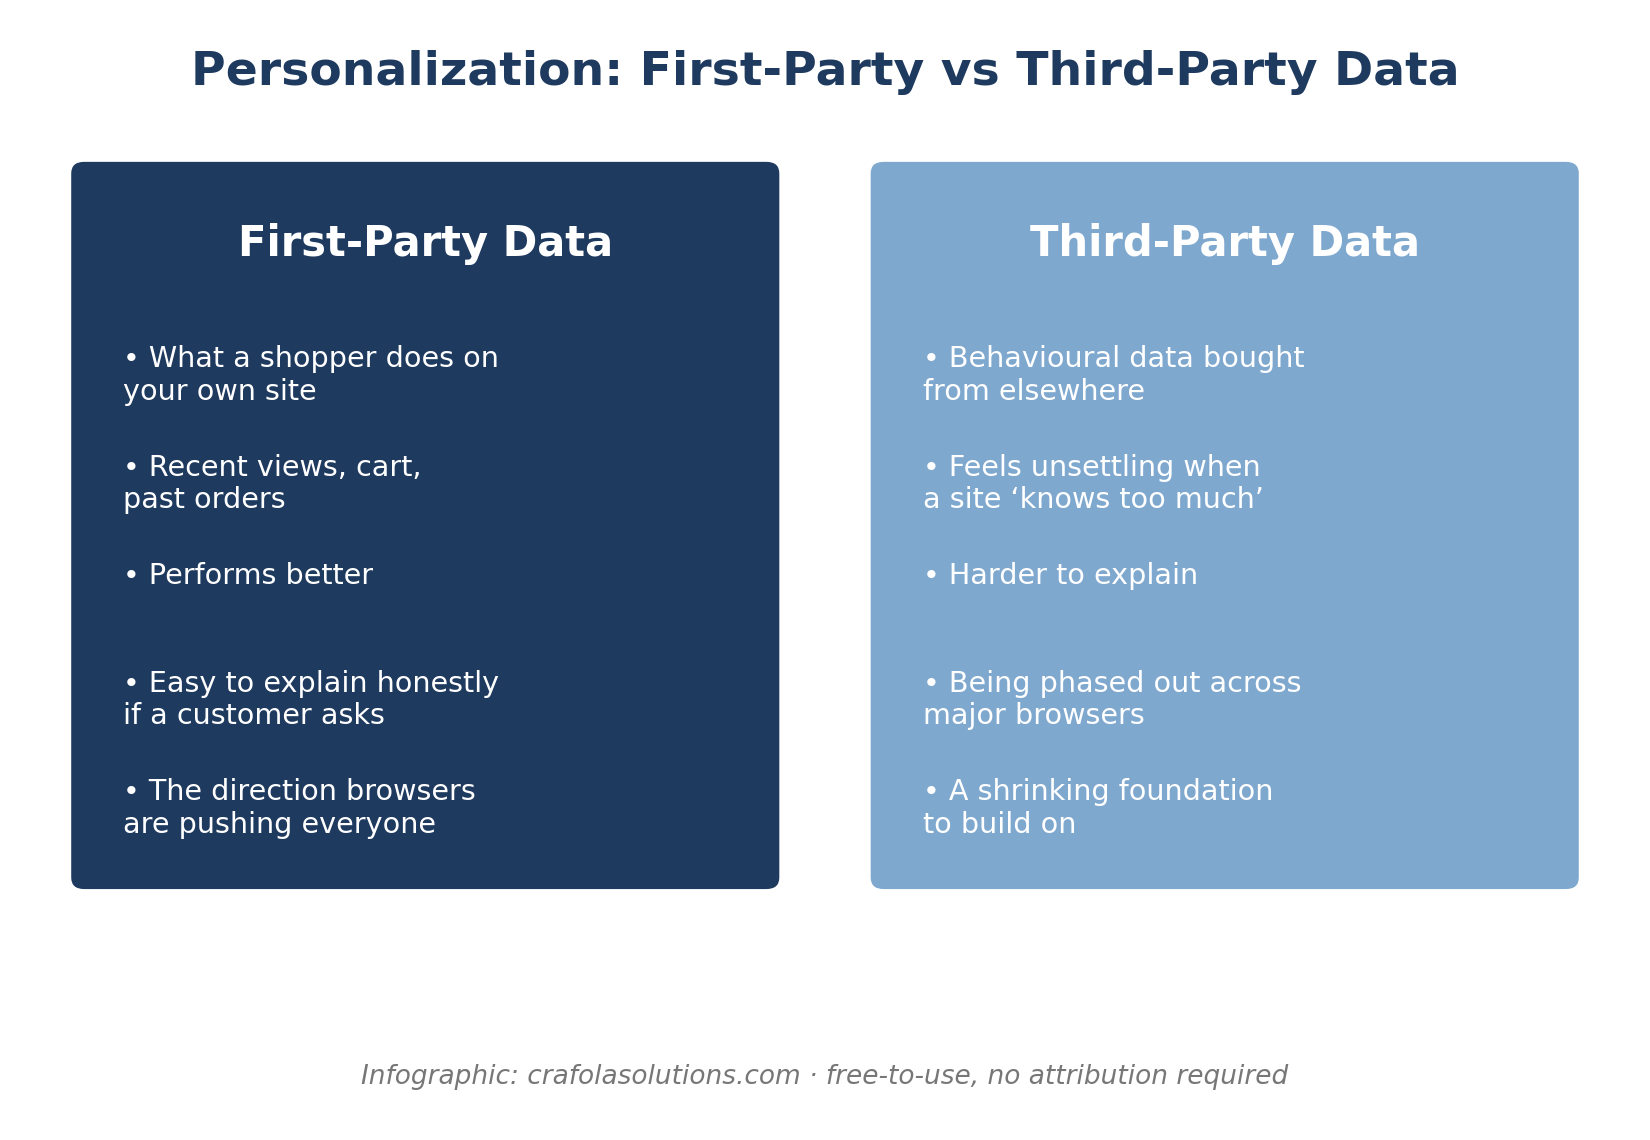
Figure 6: First-party data vs third-party data
Personalization has evolved from a simple “Dear John” in the e-mail subject line to websites that shift around on your screen depending on what products you look at.
McKinsey’s research ties effective personalization, using behavioral information to drive sales, to faster revenue growth and improved profitability, for retailers who embrace the trend, compared to those who fail to act. The reason is simple: good recommendations reduce the distance between realizing you have a problem and finding a solution. And that, in many ways, is what the previous section of this article is all about.
However, remember that any personalization effort comes with risks. Research demonstrates that beyond a certain point, shoppers begin to feel uncomfortable about receiving what appears to be targeted advertising. A good rule of thumb is to rely mostly on first party data, or information that you collect directly from your website, rather than using third party data that comes from other sources.
This approach is becoming increasingly important with the general phase-out of third-party cookies. Most browsers will no longer allow them soon, which means that personalization will be much more difficult to implement for those who do not have the infrastructure in place to collect first party data.
7. Trust You Can Actually Check
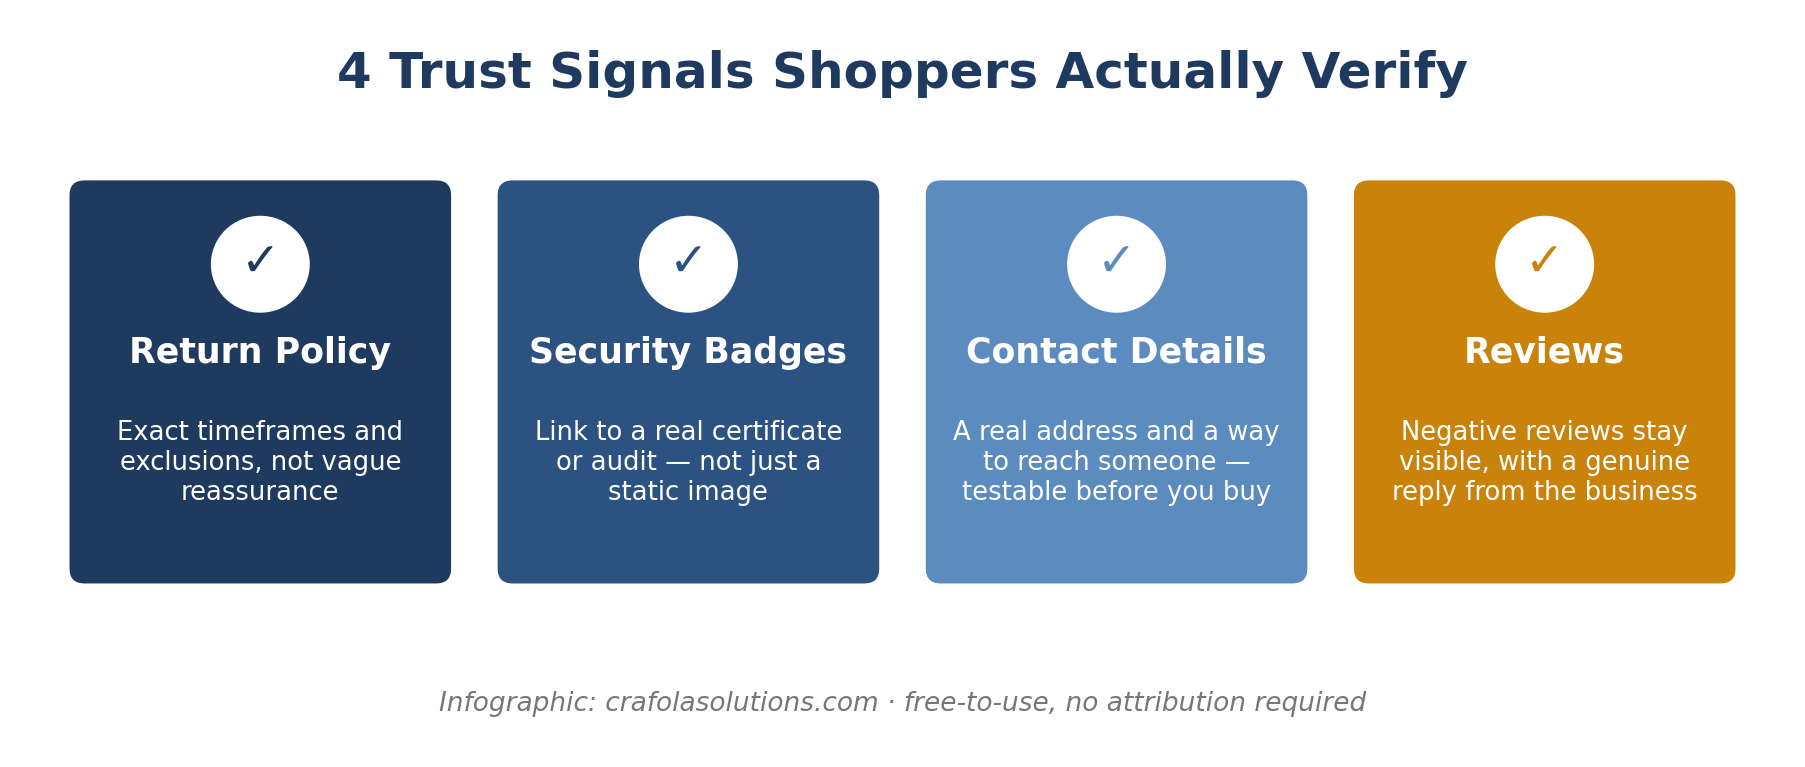
Figure 7: Four trust signals shoppers actually verify
Trust signals are only effective if a skeptical shopper can verify them. A padlock icon alone means little. What matters is whether the details behind it hold up under closer inspection.
Return policy language should provide specific timeframes and exclusions, not vague assurances. Ambiguous promises often lead to more support tickets, not fewer.
Security badges should link to verifiable information, like a certificate or an audit a shopper can check, not just static images without any backing.
Contact details should include a physical address and a reliable way to reach someone that a shopper can test before buying, not just after a problem arises.
Negative reviews should remain visible, accompanied by a genuine response from the business. A page with only five-star reviews can seem curated rather than honest.
The FTC’s Consumer Reviews and Testimonials Rule specifically targets manufactured or paid reviews, making honest review collection a legal requirement, not just a desirable practice.
Support logs are an underutilized resource. Reviewing a quarter’s worth of pre-purchase chat questions, sorted by frequency, can reveal exact gaps in your product pages or FAQs. A question asked repeatedly indicates that the page failed to provide the necessary answer.
Consistency is as important as any single signal. A return policy that reads differently on the product page than at checkout undermines the trust both versions were intended to build, even if neither is technically incorrect.
8. The Honest Psychology of a Price Tag
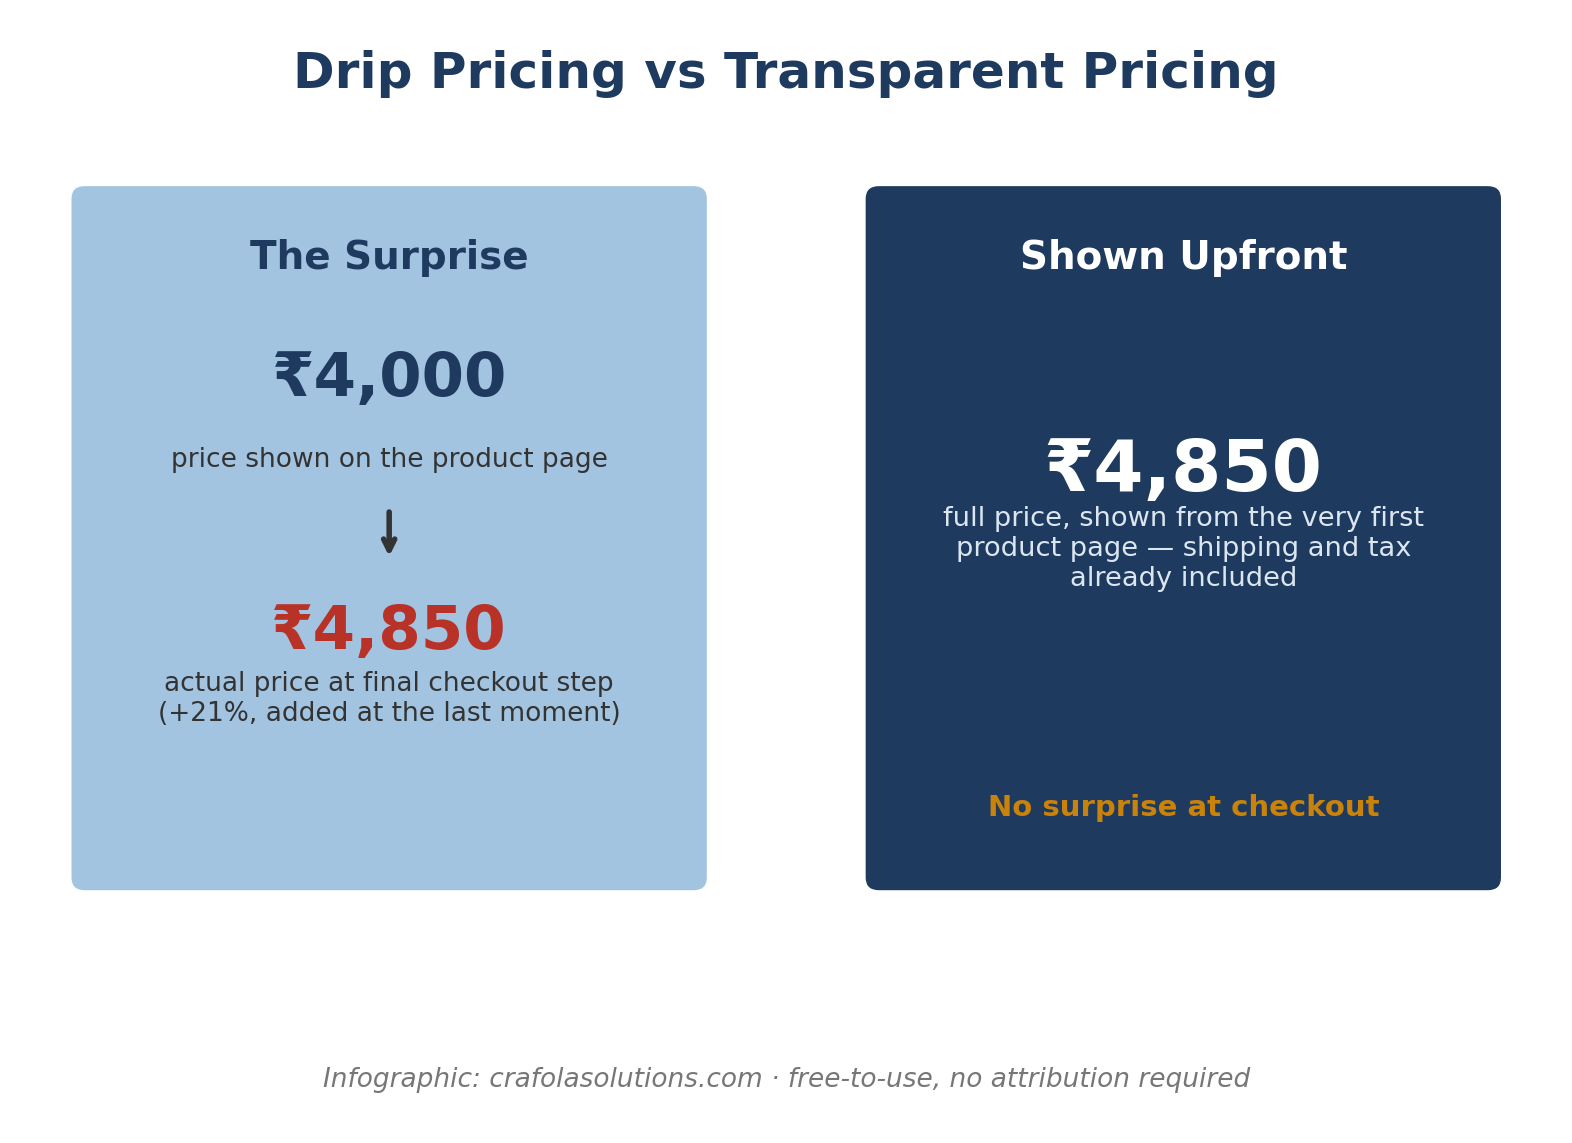
Figure 8: Drip pricing vs transparent pricing
No one evaluates the price in a vacuum. Whether ten thousand rupees is a steal or not is mostly determined by what else the customer has seen prior to arriving at this price.
So, drip-pricing, or hiding total price by tacking on additional charges at the end, is the worst offense in terms of customer pricing psychology and is also cited as a reason for abandoning purchase at checkout. Almost across the board, according to studies.
Even if a later price seems higher than what a customer might have expected to pay, showing a full price at the beginning is more honest and less likely to turn off the customer than a surprise total.
It is also crucial to recognize the power of “decoys” in tiered pricing. The decoy effect is when you have two options, but you introduce a third just to make one of the first two look better. So, if you have a ₹4K pair of shoes next to a ₹6K one, putting a ₹7.5K pair next to them will make your ₹6K option sell much better. It is generally accepted that having three options, with the decoy being closest in value to the most expensive option, is the best formula.
9. Testing, Done for Real
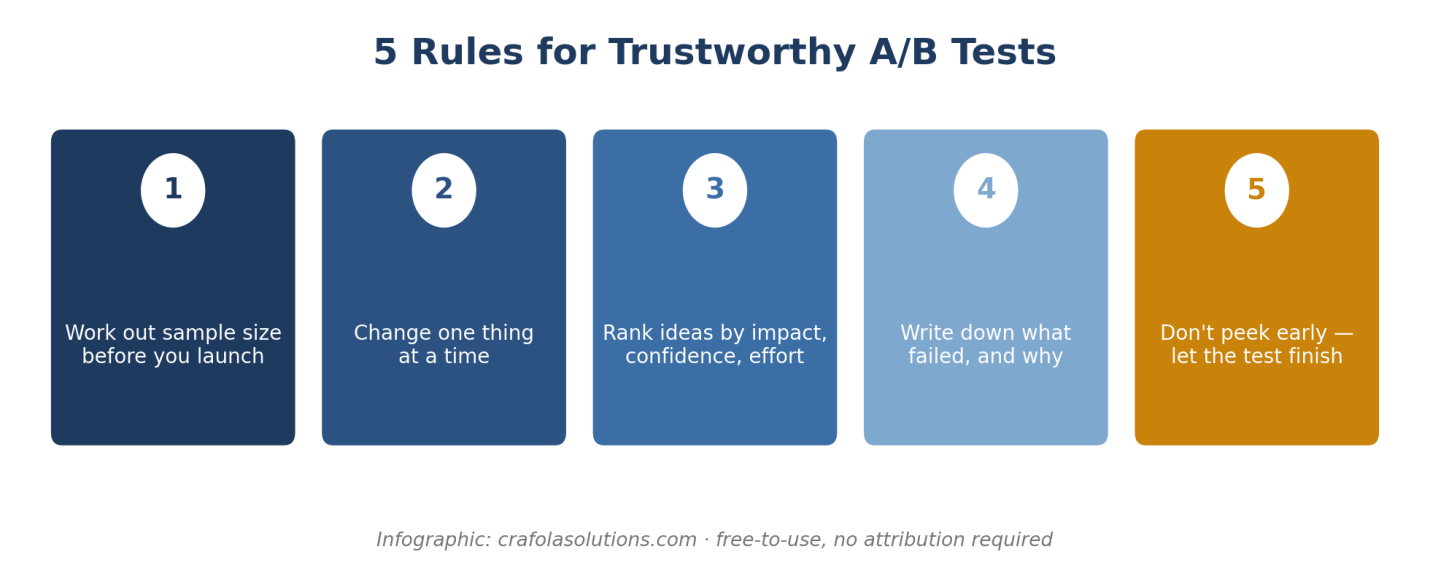
Figure 9: Five rules for trustworthy A/B tests
Most e-commerce teams engage in some form of A/B testing, but not many are successful at doing it. A test that ends up as a false-positive or does not measure what it was supposed to have done can be much worse than not running it at all.
Work out your sample size first
Any test that reaches statistical significance with only a few hundred visitors is almost certainly a false positive. Remember to calculate the required sample size based on your current conversion rate and the minimal change that you are interested in detecting.
Change one thing at a time
Always try to isolate your changes, so that you can be confident that they had an actual effect. Testing new headlines, photo and button color at the same time will prevent you from finding out which of them works.
Rank ideas by what they might do
A simple scoring model that takes “potential impact”, “confidence in execution” and “ease of implementation” into account should allow you to focus on the most promising opportunities first, rather than wasting time on anything that your team happens to discuss.
Write down what failed too
Similarly, always make sure to write down every test, including those that failed. This way, you will always have a reference point if the opportunity comes up again later and your team wants to reconsider an idea.
Do not peek and stop early
Checking the results of a test daily and stopping it as soon as it appears to have an effect will bias your results and prevent you from detecting a meaningful change.
10. Where Real Profit Actually Lives
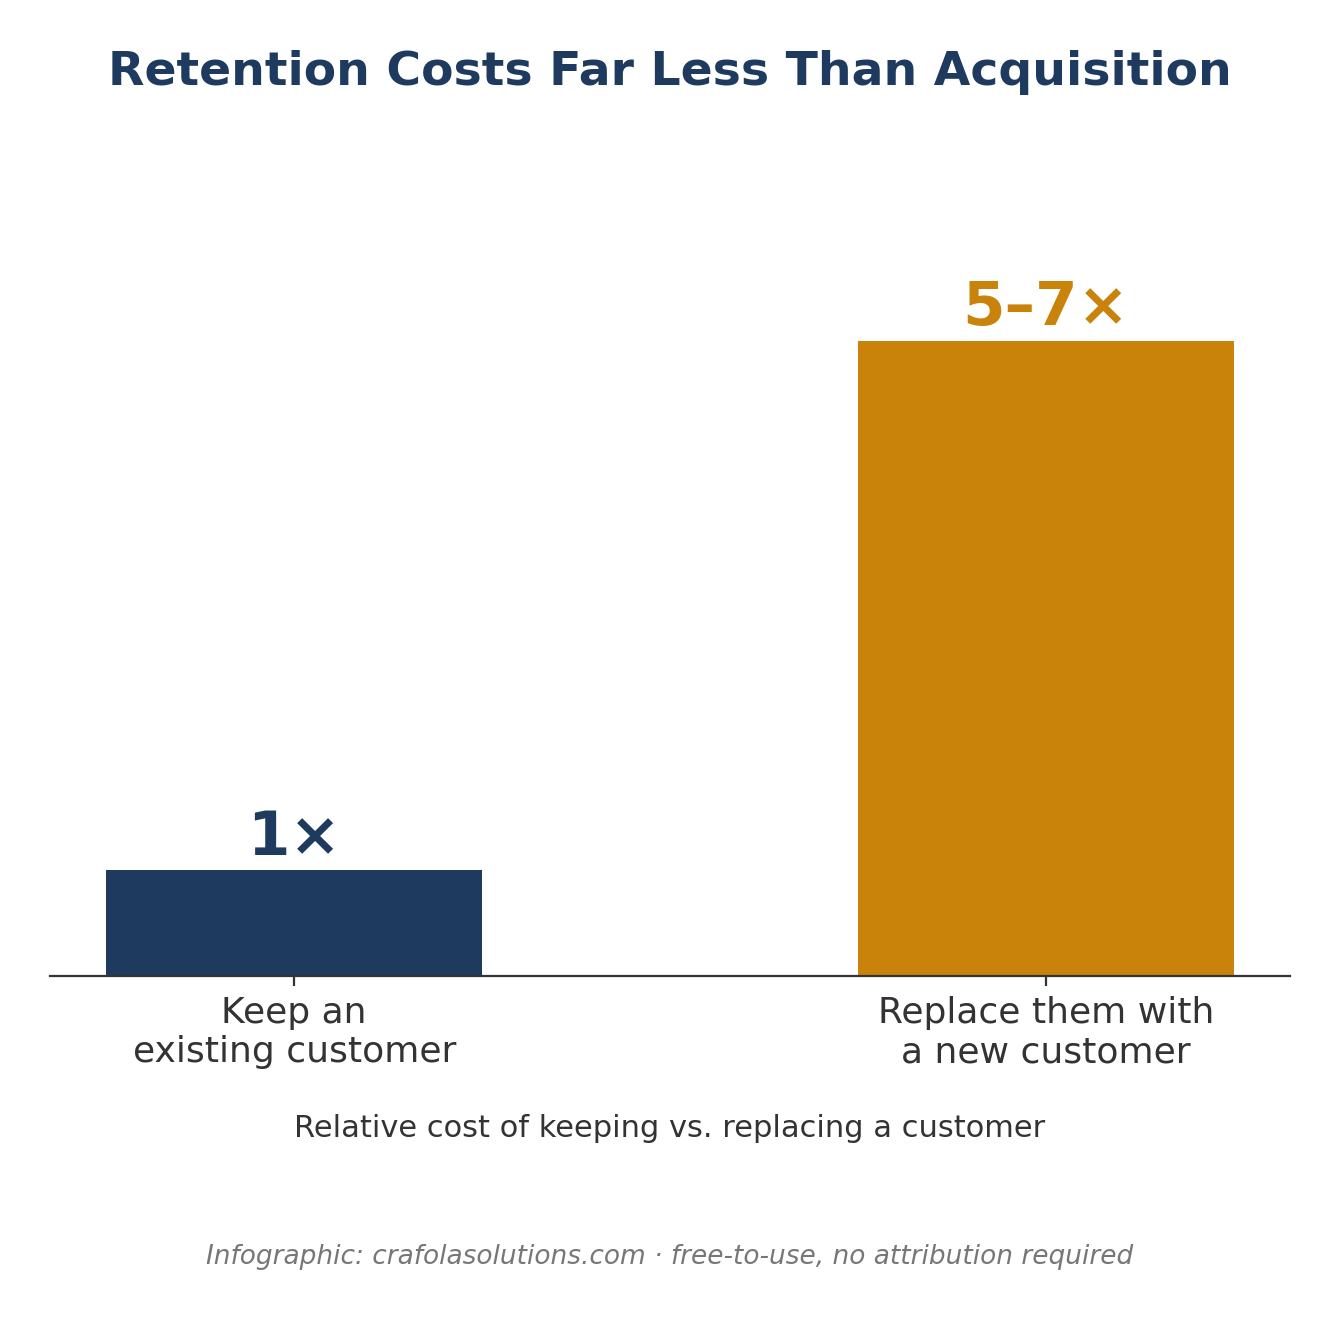
Figure 10: Retention costs far less than acquisition
It is much easier and cheaper to retain an existing customer than acquire a new one. Most e-commerce companies see somewhere between 5-7x returns on their investment when re-engaging with past buyers, compared to acquiring new ones. This is especially true for product categories, but it is always advisable to explore ways to maximize your returns.
Cohort analysis allows you to visualize how each monthly group of customers behaves throughout their journey on your website or application. It helps you identify whether the changes that you made positively or negatively impacted the experience of a particular buyer segment, compared to previous months. Particularly for new users, it can help highlight trends that may not be apparent at first, such as the fact that your January-sold buyers are significantly more likely to come back for a second purchase than those acquired in February.
A great buying experience encourages more spending by demonstrating value to the buyer. Shoppers who receive honest information about their orders and what to expect are much more likely to spend more money throughout their lifetime with the company, particularly on subsequent purchases. In fact, most repeat buyers spend more on their second order than most first-time buyers.
The priority list for optimization should always include these three items: clear purchase confirmation, honest delivery estimates and support availability. Make sure to provide excellent customer service whenever possible and ask the right questions at the most opportune times. Asking the same customer for feedback immediately after sending an order confirmation e-mail may turn them off, whereas waiting until the purchase has been delivered will achieve better results. A rough calculation of an average customer’s lifetime value can be done by multiplying the average order value by the number of times per year that they purchase from you, then by the number of years that they remain a customer. This will give you an honest metric to measure against and will ensure that you do not, for example, overspend on remarketing when trying to convince a one-time buyer to return.
Support logs should also be analyzed to identify what questions your customers are asking most frequently. A sudden spike in questions in regard to the status of an order should prompt a closer look at the fulfillment process to see what might have gone wrong. In many cases, it will indicate a simple misunderstanding on the customer’s end, or a minor hiccup that makes it harder for them to track the movement of their package.
11. The Path Every Buyer Actually Walks
Every piece of advice provided above fits within the framework of a single buyer’s journey. Shoppers walk a path of unspoken questions before committing to a purchase, and a single unresolved concern can derail the entire transaction.
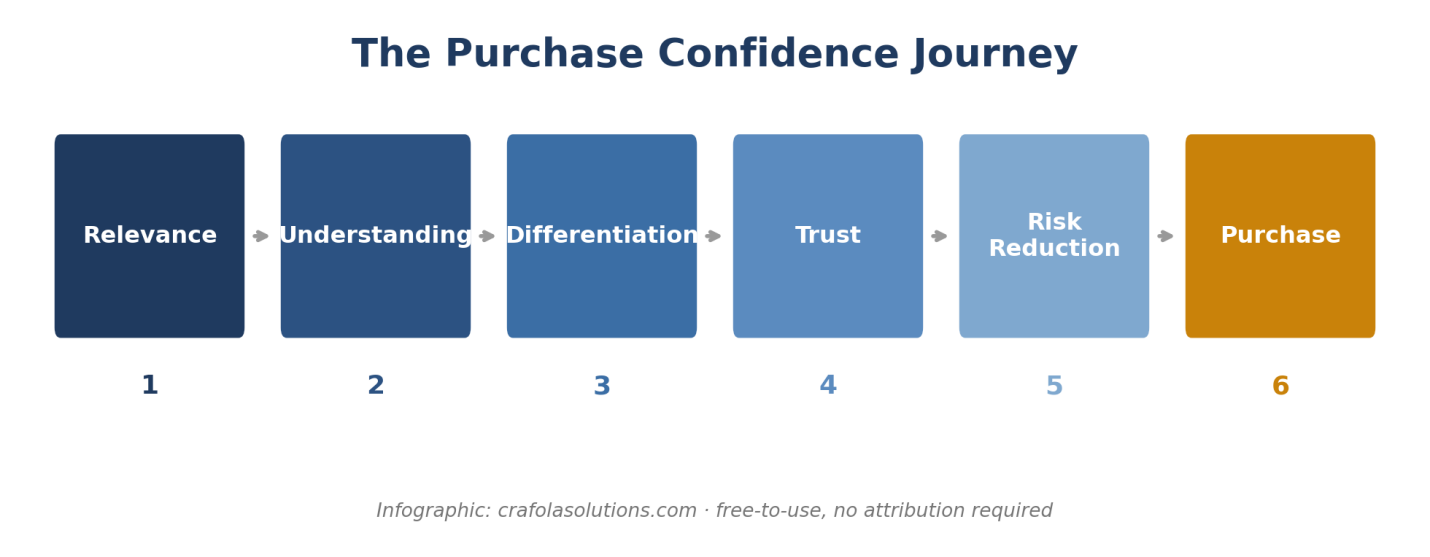
Figure 11: The questions a shopper answers before they buy
Relevance: Does this product have anything to do with me?
Understanding: Do I fully understand how this product may fit into my life?
Differentiation: Is there a reason for me to choose this option over the others?
Trust: Can I trust that this business has my best interests in mind?
Risk reduction: I understand the consequences of making the wrong choice
12. Where These Tactics Quietly Backfire
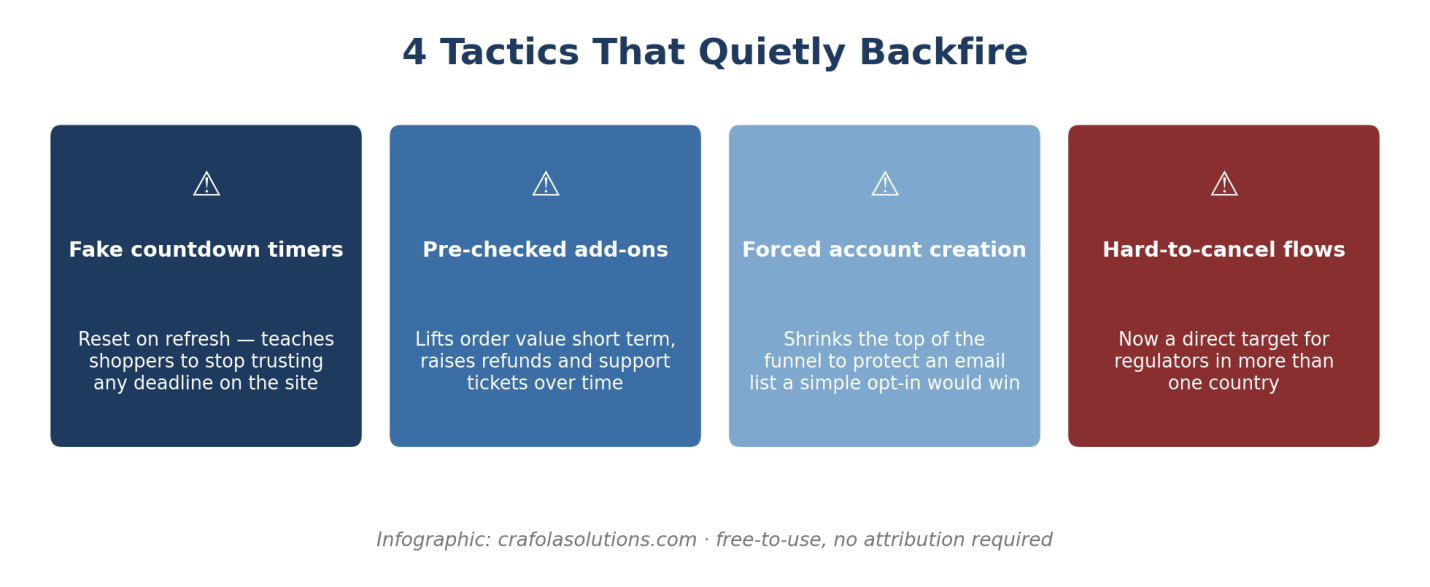
Figure 12: Four tactics that quietly backfire
Fake Countdoun Timers
The Tactic: A clock showing that a deal is about to expire, which resets every time you reload the page
Why doesn’t it work: Savvy shoppers realize almost immediately that the clock can be manipulated and that there is no hard deadline at all. After that, they don’t believe any other timers on your site or app.
Pre-checked Add-ons
The Tactic: When buying something, you are automatically subscribed to other things like magazines, warranties, and extended support – you must uncheck them before proceeding to payment.
Why it doesn’t work: Though pre-selected add-ons can give you more revenue per customer, those customers will resent you when they see their invoices later, which usually results in complaints, refunds, chargebacks, and bad reviews.
Forcing Account Creation
The Tactic: Requiring shoppers to enter personal info and create an account before they can make a purchase instead of allowing them to check out as guests.
Why it doesn’t work: This tactic will turn away all but the most persistent buyers, simply to get you to sign up for information you could have collected with much less effort during checkout.
Hard to Cancel
The Tactic: Subscribers can’t cancel service directly. They must jump through many hoops or contact customer support.
Why it doesn’t work: This one is labeled dangerous and is currently under regulatory scrutiny worldwide. If your subscribers complain, you could receive legal action and formal warnings from government agencies such as the FTC or GDPR authorities.
Closing Thought
Conversion rate optimization is not a set of tricks to be used sparingly to drive more revenue from a static customer base. It is a process that requires attention to multiple points in the customer journey before a single visitor commits to buying. No single action across these areas will deliver a meaningful result on its own.
A fast website with a difficult returns process will see cart abandonment anyway, and a product page with a compelling offer but a broken checkout will fail to deliver on its promise.
Therefore, treat conversion rate optimization as a continuous process rather than a task to be completed. The businesses that are most successful at driving sales are the ones that constantly ask themselves, ‘Why did this shopper leave?’ and test hypotheses about the possible reasons one by one. Start with the easiest wins but always follow up with research into the next-largest problem. Your conversion rate reports will show which stage of the checkout is the most frequent source of friction with the overall conversion. If your customer support team is overwhelmed by identical complaints, make resolving them your highest priority. There is always a next step on the path to better customer experience and a higher conversion rate.

Vandana is a Content Writer and Digital Marketing Executive with 1+ years of experience in SEO content writing, website content, and digital marketing. She specialises in creating engaging, SEO-friendly content, keyword research, and content planning to help brands improve their online presence and audience reach.