
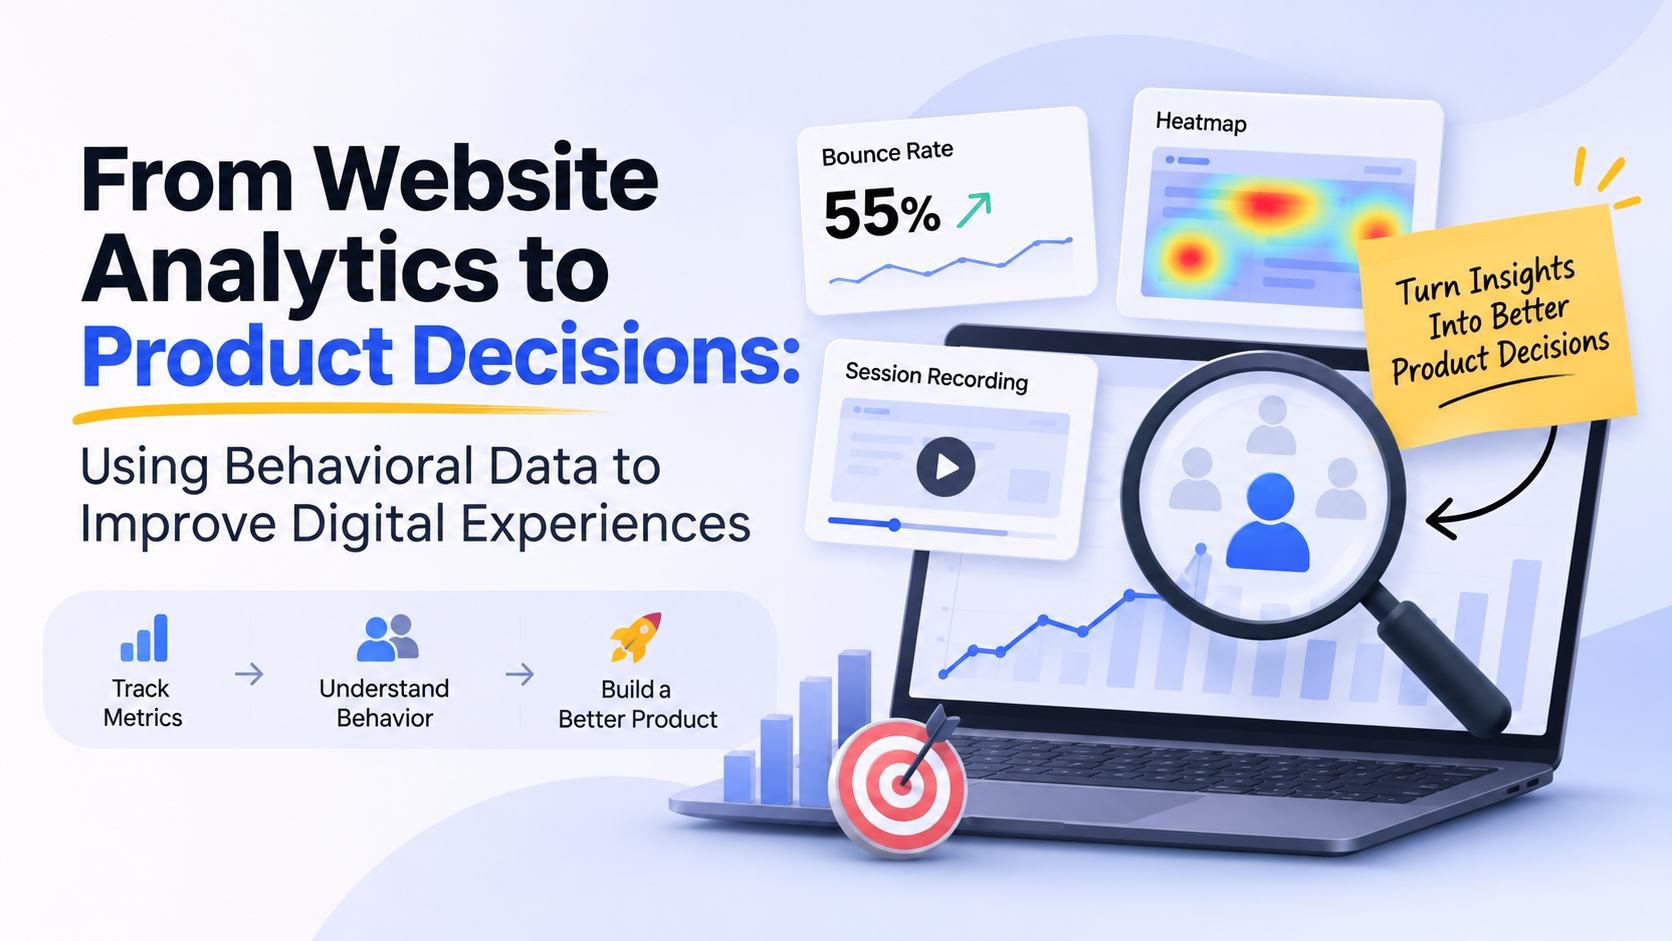
High traffic on a website looks great on a dashboard, but it hardly counts when visitors leave without completing important actions. You can track traffic reports and conversion rates through website analytics. Yet these metrics rarely show why users abandon a page or struggle to complete a task.
Without knowing why, you may invest in redesigns or new features that fail to address the real problem. The solution is to look beyond surface-level metrics and study how visitors interact with your website and where they run into friction. This is exactly what behavioral data makes visible.
Once you connect user behavioral insights to product decisions, you can prioritize the right changes and create digital experiences that serve both user needs and business goals.
Table of Contents
Why Website Analytics Don’t Always Lead to Better Product Decisions
Through website analytics, you can see where visitors leave, but not why. Suppose your pricing page exit rate jumps from 35% to 55%. You might be wondering about the reason. Are your prices too high, or is the trial button broken?
Each problem needs a different solution, but the analytics report alone can’t tell the exact cause. Three common gaps explain why.
Metrics show outcomes, not causes
Google Analytics 4 uses specific rules to detect bounces. A bounce is a session that lasts less than ten seconds, has no key event and includes fewer than two page views.
Though it flags a quick exit, it can’t specifically tell you whether visitors left because of the slow-loading pages or just because they found what they wanted.
Averages can hide specific problems
Your website might perform well overall, but still some visitors can struggle to use it. For example, mobile users abandon your registration form more often than desktop users do.
Comparing website data by device can help you close the gap. From there, you can investigate causes such as a layout that doesn’t adapt to smaller screens.
Assumptions lead to wrong fixes
If you notice your conversion rate reduces, you might change a headline or redesign a button, expecting a better result. However, the real problem could be a lengthy form or a slow-loading page. Making changes without knowing the actual cause can waste time and development resources.
The risk of fixing the wrong thing shows up clearly in cart abandonment data. According to Baymard Institute’s 2026 research, the average cart abandonment rate is around 70.19%. It is a figure that looks like a checkout problem. Yet 42% of US shoppers recently abandoned a cart because they were browsing. And 17% left over a long or complicated checkout.
So only part of that 70% points to a flaw you can fix. If you treat every abandoned cart as a problem with your website, you might change the checkout process when it doesn’t actually need fixing.
The solution is to see what visitors actually do. Product analytics tracks what users do inside your site, from clicks to completed steps. User behavior analytics, such as session recordings and heatmaps, shows where they hesitate or quit.
This helps you confirm the cause before you change anything and in this way you can start data-driven UX design from evidence.
What Behavioral Data Reveals About User Needs and Friction Points
Using behavioral data, you can understand what visitors want and where they struggle to use your website. This is how the data can help you.
● User behavior tracking records show where visitors click and how far they scroll on your website
● Heatmaps show where visitors click or stop scrolling
● Rage clicks, which are repeated clicks with no response, often point to a broken element
● Dead clicks happen when visitors click something they expect to work, but nothing happens
● Session recordings allow you to replay real visits and show hesitation that numbers can’t
● Repeating patterns reveal what user behavior says about unmet needs

How to Turn Behavioral Insights Into Actionable Product Decisions That Improve Digital Experiences
Collecting user behavioral data is not a difficult task. But turning it into a change that makes the experience better can be challenging. Once you notice a pattern, your next goal is to understand its cause, test a solution and measure whether it improves the digital experience. Here is how to do that.
Find Where the Journey Breaks
Before you do anything else, find the exact step where visitors leave without completing an action. The easiest way is to map the journey as a funnel. The funnel shows the steps a visitor takes to reach a goal.
For example, on a pricing page, visitors might view the plans, open the demo form, and submit their details. Once you check Google Analytics 4 (GA4), you can see how many visitors move from one step to the next and how many leave along the way.
Suppose 200 visitors open the demo form, but only 140 submit it. This means 30% leave without completing the form. So you need to investigate this step first.
Finding where the user journey breaks helps you identify where visitors struggle and investigate the likely cause before changing the page.
Segment Your Visitors
When you look at overall metrics, you might not be able to understand the exact problem affecting a particular user group. Segmenting your visitors can help, as it splits visitors into groups, such as device, traffic source, or new versus returning.
This helps you make targeted improvements for the visitors who need them, without unnecessarily changing an experience that already works well for others.
Pair the Numbers With Real Feedback
Digital product analytics shows where visitors leave, but not why. To understand what is happening, watch session recordings from the weak group, read support queries, or ask a few users directly.
When you combine analytics with real user feedback, it helps you address the underlying problem rather than guessing at a fix based on metrics alone.
Write a Hypothesis and Test It
Before making a single change, write down what you believe will improve the experience and why. For example, “Displaying pricing plans in a clear vertical layout on mobile will increase demo requests as visitors won’t have to scroll sideways.”
You can test it with an A/B test. This shows the original page to half your visitors and the revised page to the other half. Change one element at a time and let the test run long enough to gather a meaningful sample.
Also track a guardrail metric such as lead quality, so you know the lift isn’t coming from weaker sign-ups. Thus product decisions become evidence-based.
Prioritize by Impact and Effort
You don’t need to fix every problem. Rank each one by business impact, strength of evidence, users affected and effort required. Invest the time and the money to fix a real problem.
This helps you make data-driven UX design decisions based on real problems, because every choice has evidence behind it.
Measure the Result and Keep Improving
Even if a test shows good results, don’t forget to check how the change performs after it goes live. Track the same conversion metric and another important measure, such as lead quality, for the next few weeks. Compare these results with the numbers you recorded before the change to see whether the improvement lasts.
If the results start to drop, you can investigate and make further changes. Then, check your website analytics again to find the next problem to solve.
Repeat the loop after each launch, and digital experience optimization becomes routine instead of a yearly redesign.
Putting Website Analytics and Behavioral Data to Work on Your Product
Website analytics helps you understand where visitors leave, and behavioral data explains why they left. Together, analytics and behavioral data turn a vague exit rate into a specific fix you can test.
Start small. Pick one page with a high exit rate, watch some session recordings and come up with one hypothesis and one test. You’ll learn exactly what to build, improve, or remove next.
Over time, that habit will change how you make product decisions. Decisions will stop being based on what people think and will start being based on what people do. This makes every decision easier to explain and support.

Vandana is a Content Writer and Digital Marketing Executive with 1+ years of experience in SEO content writing, website content, and digital marketing. She specialises in creating engaging, SEO-friendly content, keyword research, and content planning to help brands improve their online presence and audience reach.